Data Case Studies for Higher Education providers
In this section there are four case studies to illustrate some of the information that has been covered.
Case study 1: Using Higher Education Statistics
To support a request for additional staffing a disability service looked at the growth of students with disabilities coming the university compared with staffing levels over the same period.
The graph below shows the relative percentage increases of all domestic students (an increase of 19.4% over a 5-year period). The increase of students with disability (from the Higher Education Statistics was 104.5%. The increase of students registered for Deakin's Disability Services was 120.4%.
The way this information is presented (i.e., via graph) can be useful in telling the story and has been used at the University to successfully argue for increases in staff.
Graph 1: Percentage increase of all domestic students vs students with disability 2006 - 2022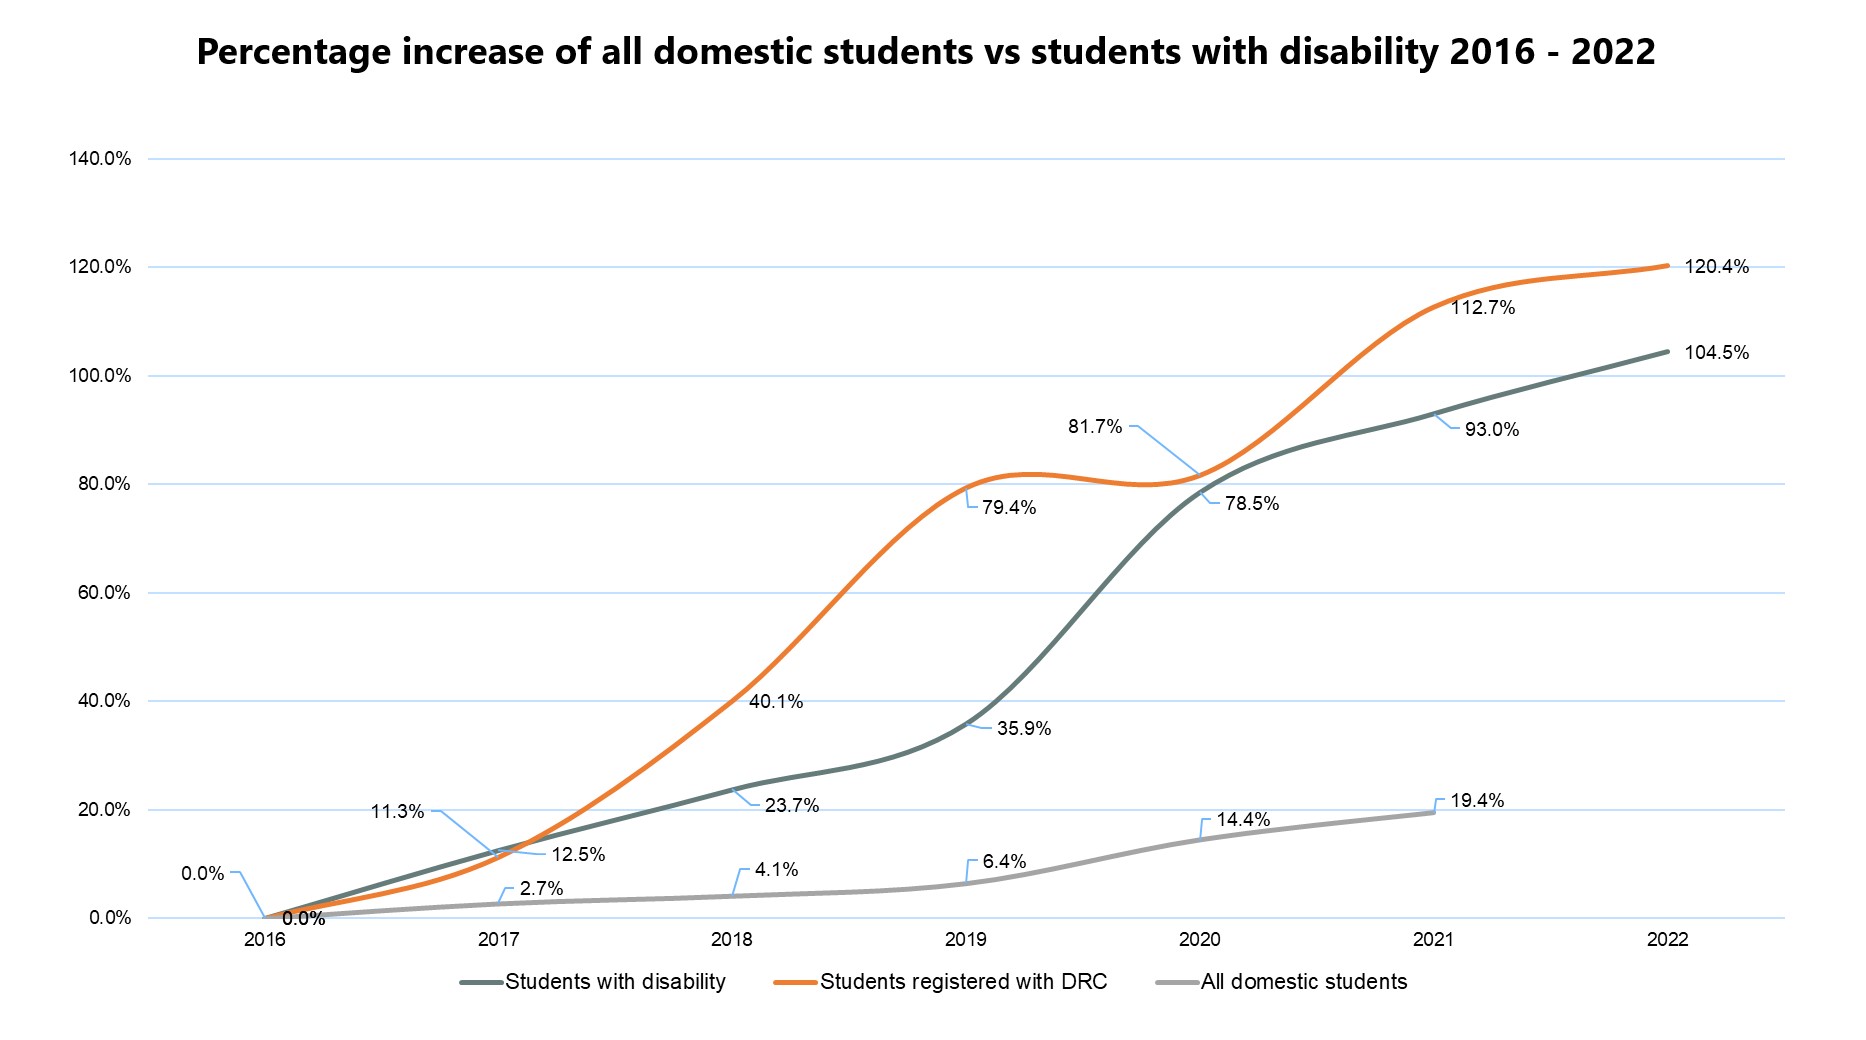
Another example of increases over time. The bar graph below shows the increases in the number of access plans sent out over the past few years in the three trimesters (note T3 not available yet for 2022).
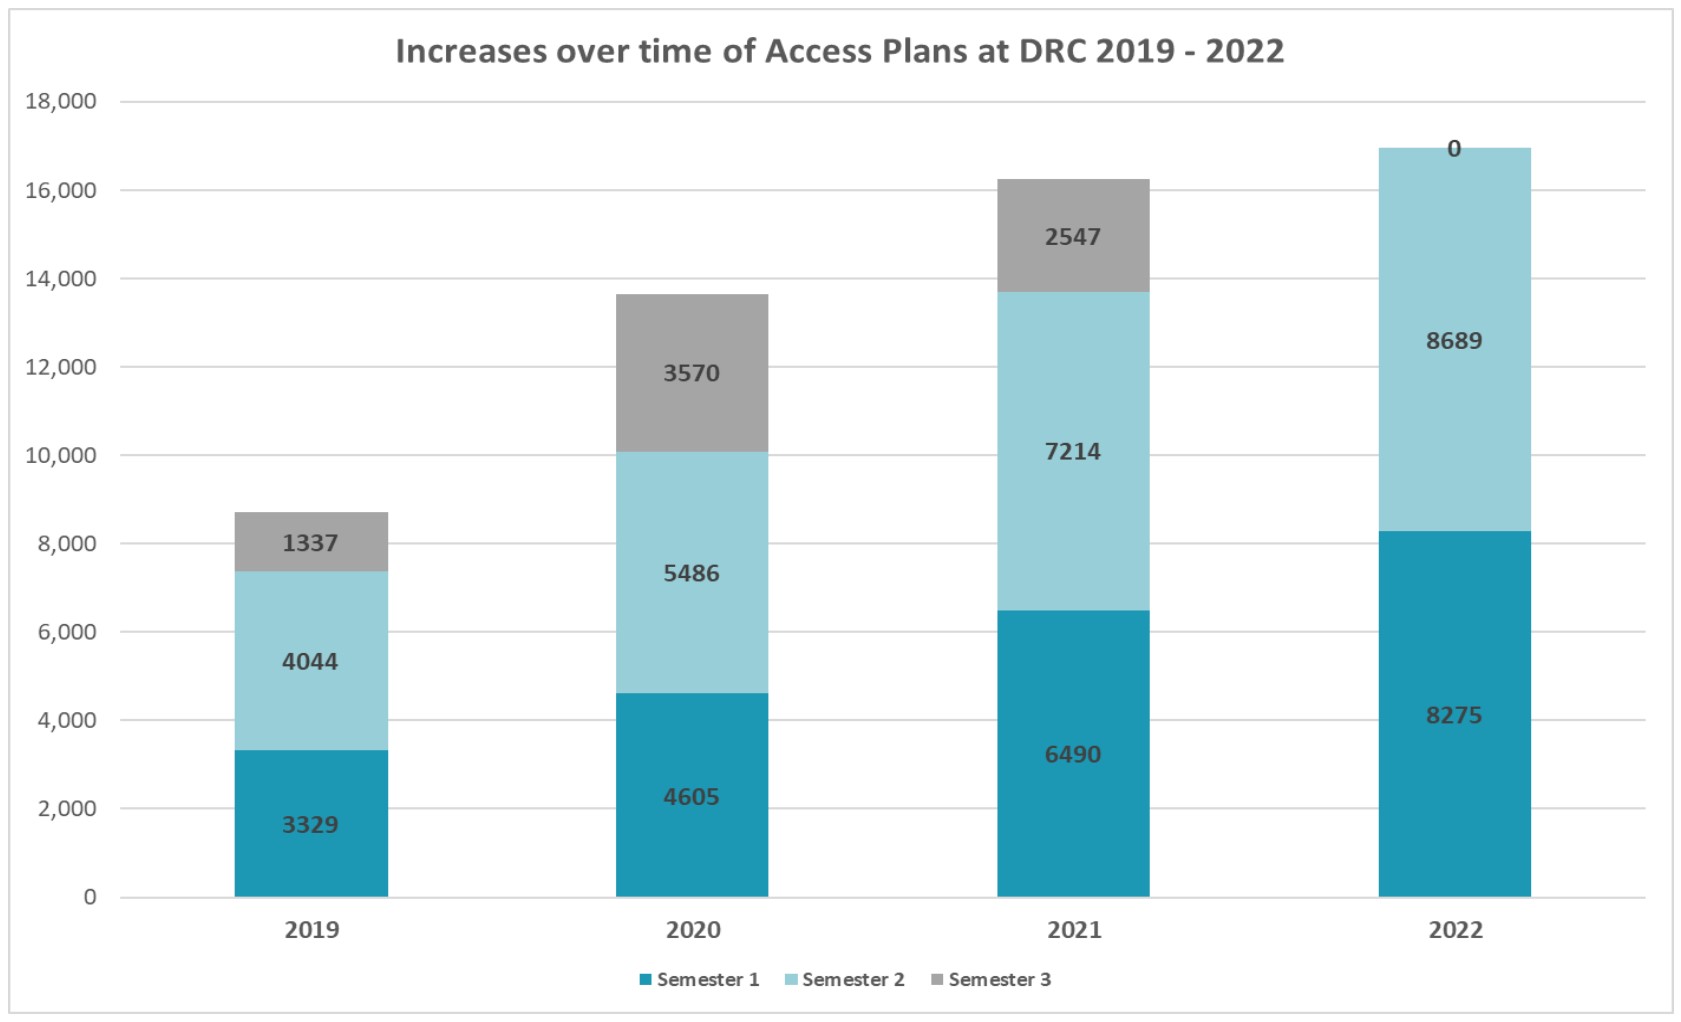
This sort of information can also be broken down by faculty or school and can assist us to understand the impact of access plans on teaching staff.
Other examples of longitudinal data that people have used over time might include:
- number of students per FTE of disability support team
- access, retention, participation and success statistics for students with disability
- specific program statistics e.g., participation rates for students with disability compared with other students in First Year Experience programs, mentoring programs, and career services.
Case study 2: Informing a mental health strategy
To inform the University’s bid to support a formal mental health strategy this University pulled together data from multiple sources to support its case including:
- Institutional data
- Higher Education Statistics
- Student Experience Survey (QILT) data.
Institutional data and Higher Education Statistics
Prior to 2020 mental health conditions did not have a specified reporting category prescribed by the Commonwealth Government. Due to this, mental health conditions were often reported as ‘Other’ on student enrolment records. The university merged information from their disability service with enrolment information to get a more accurate indicated of disability types.
For this analysis disability types were assigned to the following groupings:
- mental health specified – included all students where mental health was specifically reported.
- could include mental health – included students who reported a disability type as ‘Other’ (prior to 2020).
- does not include mental health – included all other students with disability where nature of reported disability did not include mental health.
This information was then reviewed against access, retention and success rates for students. It was found that:
- the introduction of a suitable category for mental health conditions showed approximately half of all commencing students with disability indicated they had a mental health condition
- retention rates showed no real difference between students with mental health conditions compared with other disability types
- students with disability have lower success rates than people students without disability. Within the disability cohort it appeared that students who do not have mental health concerns are more successful than students who do.
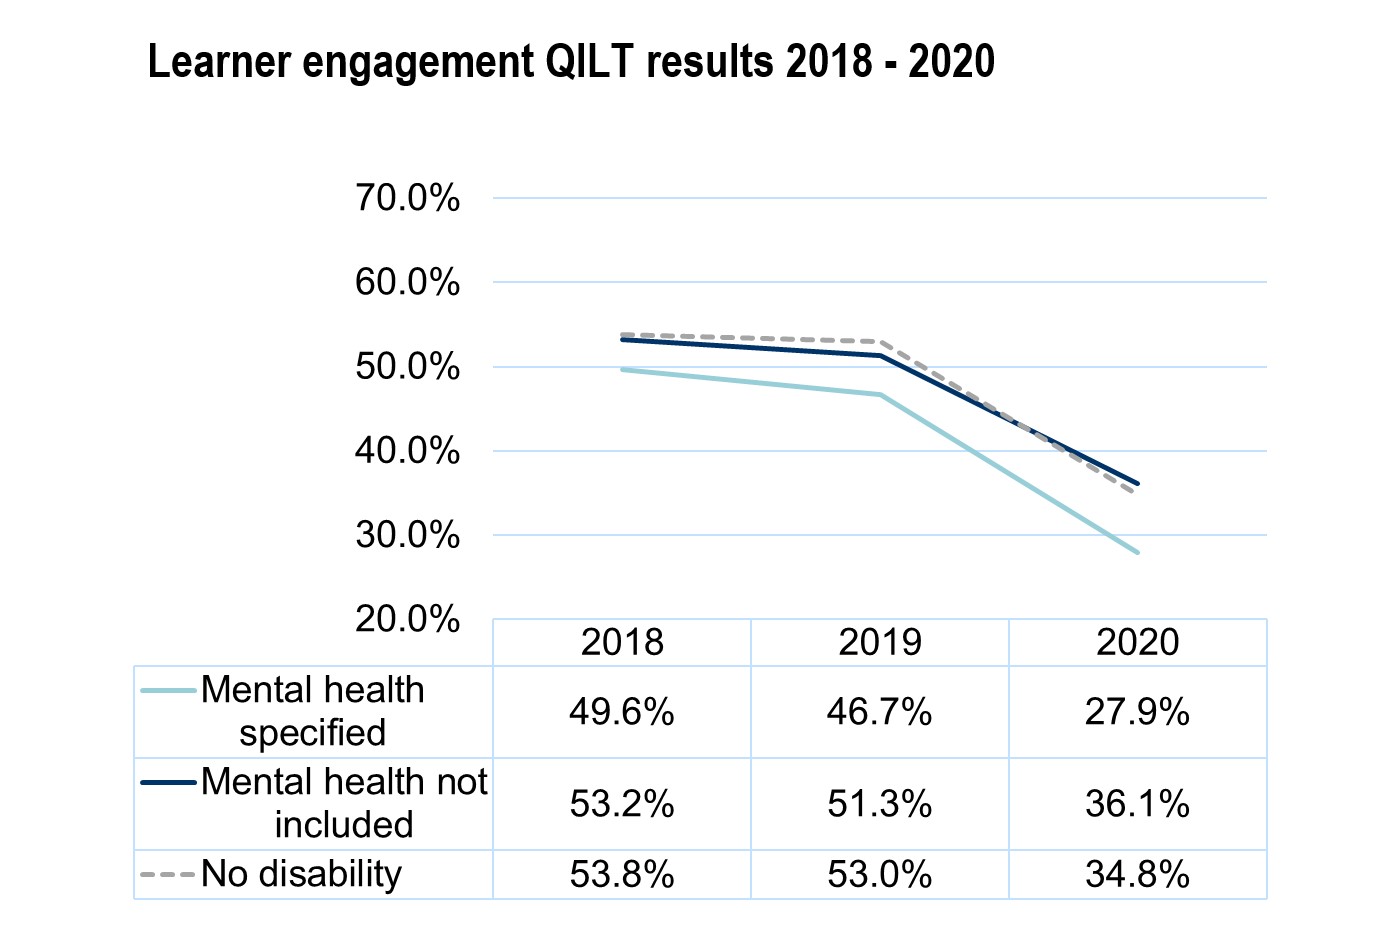
QILT data
QILT’s Student Experience Survey (SES) is a national survey of currently enrolled students (commencing and later year/completing) conducted in August-September each year. The SES asks students about their university experience in relation to skills development, learner engagement, teaching quality, student support and learning resources as well as a measure of overall satisfaction.
The Learner Engagement scale is made up of items relating to student interactions during/outside of study and feeling a sense of belonging to the institution. Students with mental health concerns reported lower levels of learner engagement across the time series. In addition, the quick switch to online learning in 2020 was particularly disruptive for all students resulting in satisfaction with learner engagement falling to 27.9% for students with a mental health condition compared with 34.8% for students without.
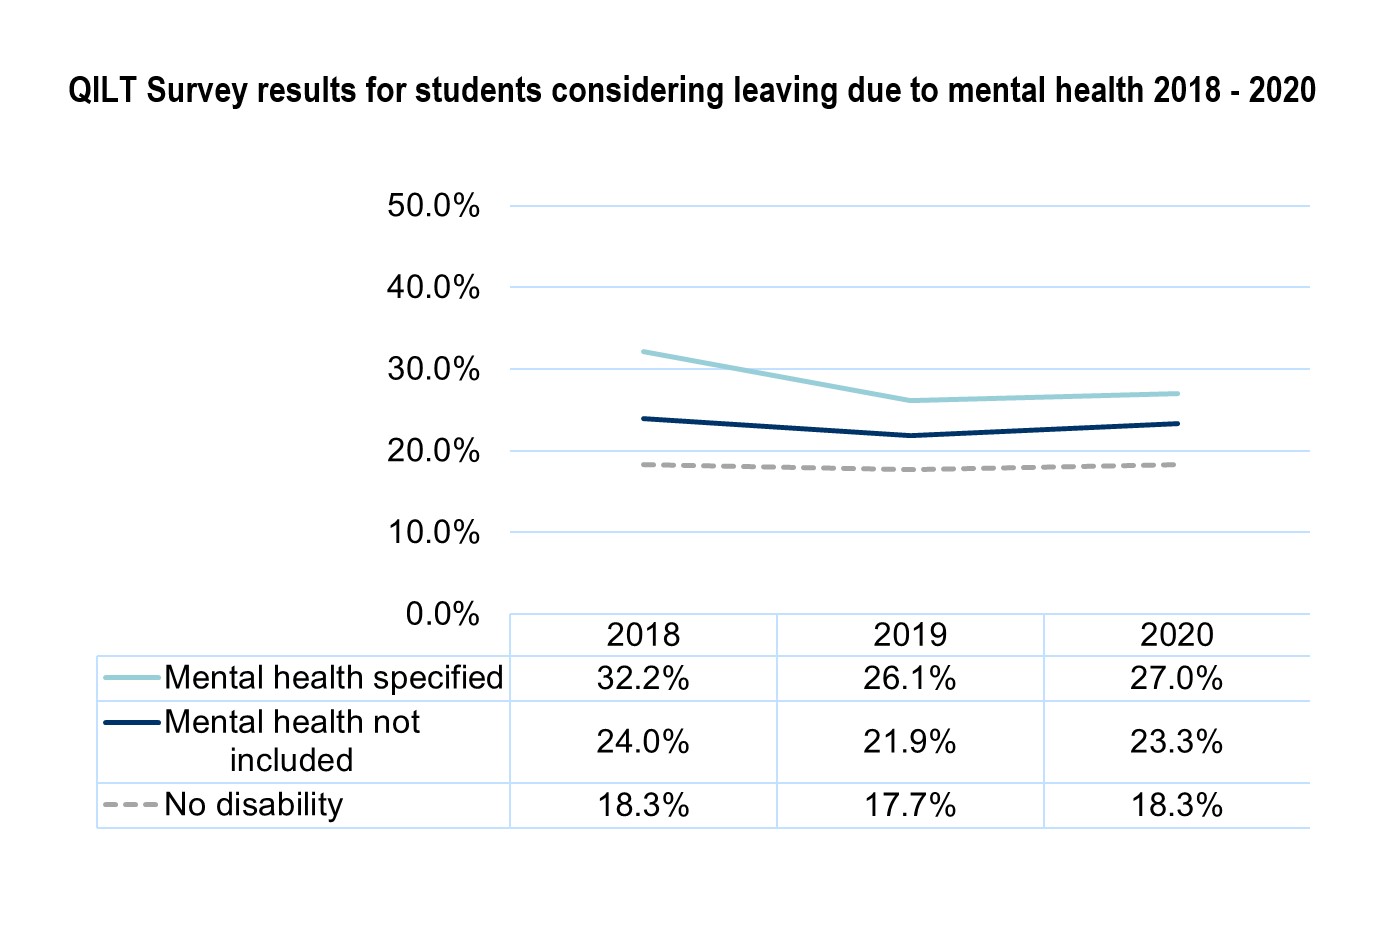
The University also found that the main reason students reported considering leaving study due to health or stress. In this case 80% of students with mental health concerns who considered leaving study indicated that it was due to health or stress. This was 27.3% for students with a mental health condition compared to 18.3% for students without a reported disability in 2020.
By looking at the findings from this all this data analysis, the disability services team pulled together key data findings as well as qualitative data (e.g., survey results from students with mental health conditions to illustrate key points). They included quotes from students with mental health conditions who had been involved in a ‘students helping students’ research project on their experience of university. They also looked at service information such as the numbers of access plans and most common types of adjustments for students with mental health conditions.
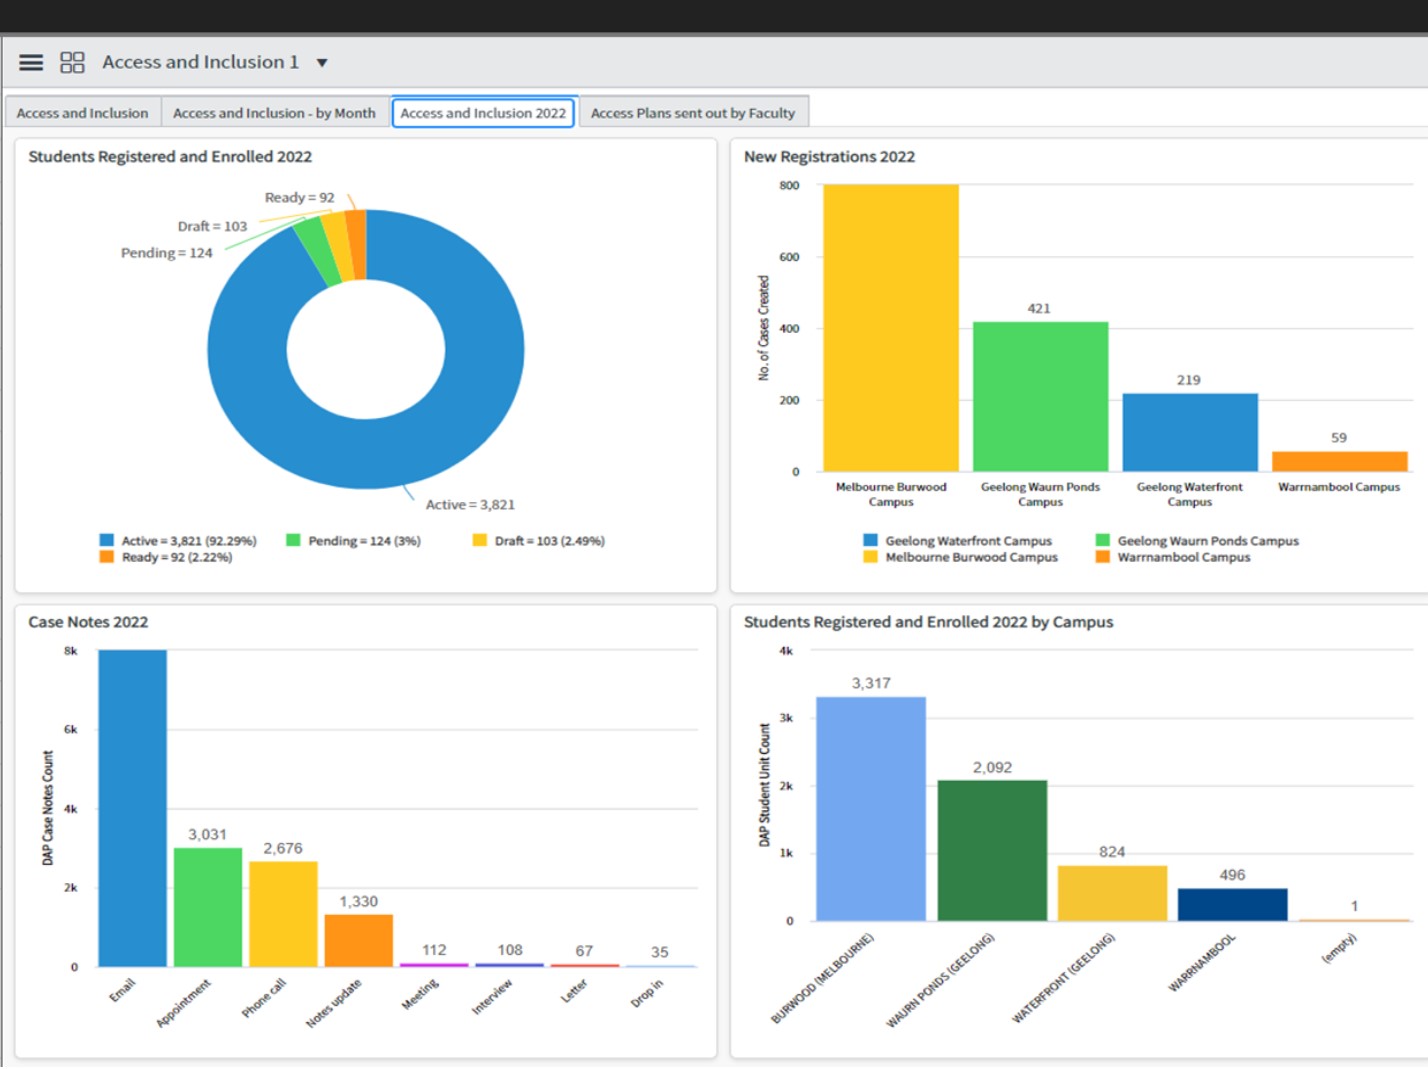
Case study 3: Dashboards and reports for informing service delivery
Developing good reporting through dashboards or report builders in your disability service area and through your planning unit is vital. These reports should not be created for the sake of reporting but to provide meaningful data for your team, planning teams and senior leaders.
Work with people such as experts in your planning unit to set up a dashboard or relevant report. As part of the development, you should ensure that your own team are being professionally developed in how to use the dashboard efficiently. This is a valuable skill.
For this university the dashboard provided:
- overall access and inclusion data for students with disability
- service specific information such as student numbers, case note numbers, and learning access plans numbers
Access and Inclusion data
Essential snapshots provided details on:
- the number of access plans to unit coordinators per trimester/semester
- students with pending and outstanding documents
- trends about peak registration periods.
Service data
This Dashboard pictured below provides a snapshot of the current year including:
- type of interaction via Case Notes including number of appointments, emails, phone calls etc. Useful for workplace planning
- registration and enrolment information by campus, faculty and school
- high volume units where additional support from the Disability Services Team might be required at the commencement of the trimester/semester and to quickly access Unit Coordinator and student information easily.
The implementation of a useful day-to-day ‘recent contacts’ panel has been especially useful as a recent addition as a disability services team can check who has had contact with the team after a period of absence by the student.
Case study 4: Partnerships with researchers
A final area of opportunity is in working with researchers. Deakin University worked in partnership with CRADLE (Centre For Research In Assessment And Design For Learning) to combine the best of research and practice in designing inclusive assessment.
A chance conversation led to:
- the key question ‘what can we learn from assessment adjustments that can inform inclusive assessment’?
- the potential of the database! (and needing to manage its popularity)
- the value of the students and team to the research (opening that opportunity and what it has added to the work)
- developing evidence to support practical service delivery in support as well as learning and teaching.
The result was a range of internal and external presentations, publications and further research.
Partnerships between practitioners and researchers are important because:
- each group can learn from each other
- ethics and research-based activities can open up new opportunities
- opportunities from cross-disciplinary activity e.g., inclusive practice; health and wellbeing, assistive technology etc
- practitioners can participation in research and publication i.e., applied research
- research opportunities can be opened up nationally and internationally through networks
- opportunities to include students as partners
- develops an academically rigorous evidence base for more support.